Everyone claims their city has the worst water. We decided to settle it with documents instead of anecdotes: over the past two weeks we read the official water quality reports (the EPA-mandated Consumer Confidence Reports in the US, the NOM-127 lab reports in Mexico, the SISS evaluations in Chile) for more than thirty municipal systems across the hemisphere, and extracted every hardness and TDS figure the utilities themselves published. This is the ranking that came out.
Two ground rules made this list possible, and they're the same rules behind every city page on this site. First: every number comes from the utility's own published report: no third-party databases, no vendor blogs, no estimates. Second: where a utility didn't publish a value, it isn't on the list. That second rule matters more than you'd think, and we'll come back to it.
Reading the Numbers
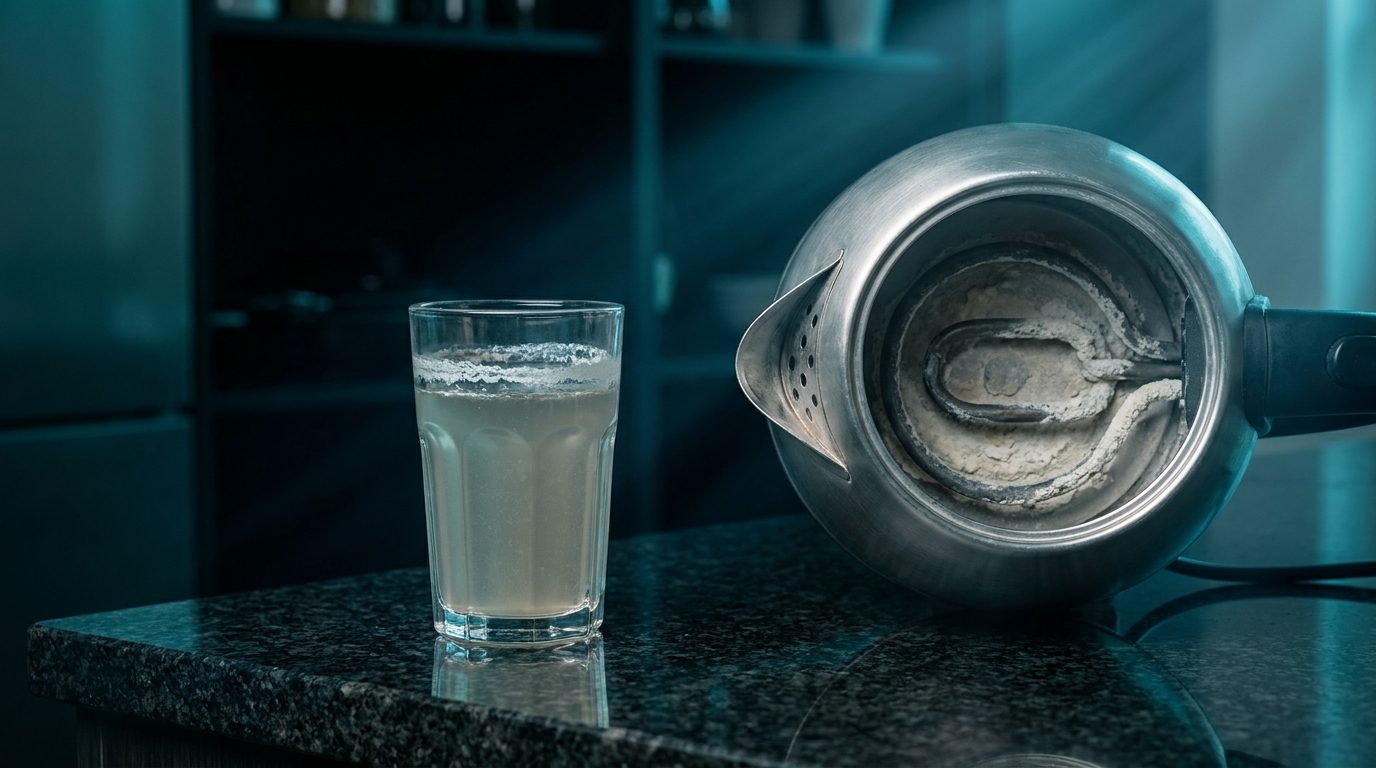
Hardness (calcium and magnesium, measured as mg/L of CaCO₃) is what scales your boiler, your espresso machine, and your RO membrane. The USGS calls anything over 180 mg/L "very hard." Every single city on this list clears that bar with room to spare. Total dissolved solids (TDS) is the broader mineral load; the US federal aesthetic guideline is 500 mg/L, and roughly 1,000 marks the edge of brackish, water salty enough that it sits in the same design class as desalination feed.
One honesty note before the tables: report years differ (2022 to 2025, each row says which), some utilities publish system averages while others publish worst-zone values or ranges, and we label each accordingly. This is as close to apples-to-apples as public documents allow. Values marked * are from Alamo's 2022 report, the most recent in which that utility published its mineral panel; its newer reports don't republish secondary constituents.
The TDS Ranking: Brackish City Water Is Real
| # | City / system | TDS (mg/L) | Detail | Report year |
|---|---|---|---|---|
| 1 | Mercedes, TX | 1,250 | above the 1,000 brackish line; sulfate 389 | 2025 |
| 2 | Copiapó, Chile | 1,212 | sulfate at 449 vs a 500 limit; the utility already runs RO | 2022 |
| 3 | Calama, Chile | 1,128 | arsenic treated to exactly the legal limit | 2022 |
| 4 | Alamo, TX | 1,100 | sulfate 311, chloride 278 | 2022* |
| 5 | Antofagasta, Chile | 966 | seawater-desalination city; chloride 256 | 2022 |
| 6 | Brownsville, TX | 772 | range 639 to 905; PFOS also detected | 2025 |
| 7 | Mission (Sharyland WSC), TX | 718 | range 701 to 737 | 2025 |
| 8 | Phoenix, AZ | 464 to 716 | published as a range; tops the 500 guideline | 2025 |
| 9 | Hermosillo, México | 531 | worst zone; the city spans 169 to 531 by district | 2024 |
| 10 | Monterrey, México | 346 avg | semester reports have run 241 to 546 | 2024 |
Sit with the top five for a second: four of them are at or above 1,000 mg/L. That is municipal tap water in the same TDS class as brackish well water, the kind of feed for which brackish-water RO membranes were invented.
The Hardness Ranking: Scale Country
| # | City / system | Hardness (mg/L CaCO₃) | Detail | Report year |
|---|---|---|---|---|
| 1 | Alamo, TX | 396 | ~23 grains per gallon | 2022* |
| 2 | Brownsville, TX | 358 | range 341 to 374 | 2025 |
| 3 | Mercedes, TX | 325 | paired with the #1 TDS | 2025 |
| 4 | Mission (municipal), TX | 318 | newly published in the 2025 report | 2025 |
| 5 | Phoenix, AZ | up to 302 | 172 to 302; utility states 10 to 17.6 gpg | 2025 |
| 6 | Monterrey, México | 292 avg | records up to 371 | 2024 |
| 7 | Las Vegas, NV | 280 | the utility itself says "set your softener at 16 grains" | 2025 |
| 8 | Mission (Sharyland WSC), TX | 280 | range 277 to 282 | 2025 |
| 9 | Hermosillo, México | 257 | worst zone; 120 to 257 across the city | 2024 |
For context: at 180 mg/L the USGS already calls water "very hard." The Rio Grande delta towns (Alamo, Brownsville, Mercedes) run at roughly double that.
The Cities That Aren't Here (and Why That Matters)
El Paso, Tucson, San Antonio, Houston and most other big utilities don't appear above, not because their water is soft, but because hardness and TDS are non-mandatory "secondary" parameters that most US utilities simply leave out of their reports. San Antonio's Edwards Aquifer water is famously hard; the utility publishes those numbers only to a state database. Chile's NCh409 standard doesn't regulate hardness at all. Absence from this ranking means absence of published data, never a clean bill of health, and it's exactly why we build verified city profiles from whatever each utility does publish, and note honestly what it doesn't.
What To Do With This If You Operate Equipment in These Cities
Above roughly 250 mg/L hardness, scale on heat-transfer surfaces is a matter of months, and a quarter inch of it cuts heat-exchanger efficiency by about 40%. Above 500 to 700 mg/L TDS, softening alone stops being the answer, because sulfates and silica scale too: that's membrane territory, with a properly dosed antiscalant and a recovery target set from the actual water analysis. The full logic is in our guides to RO vs. softeners and brackish-water RO design.
Enviro Membranes stocks brackish-water RO elements, built for exactly the water at the top of these tables, with same-day shipping from McAllen, Texas, across the continent. Find your city's verified profile (or en español), and if your city isn't there yet, send us your utility's report and we'll spec against it.
Sources
- Each city's figure links to its profile page, which cites and links the utility's original report (CCR, NOM-127 lab report, or SISS evaluation) with year.
- USGS: Hardness of Water (classification bands)
- EPA: Secondary Drinking Water Standards (TDS 500 mg/L guideline)