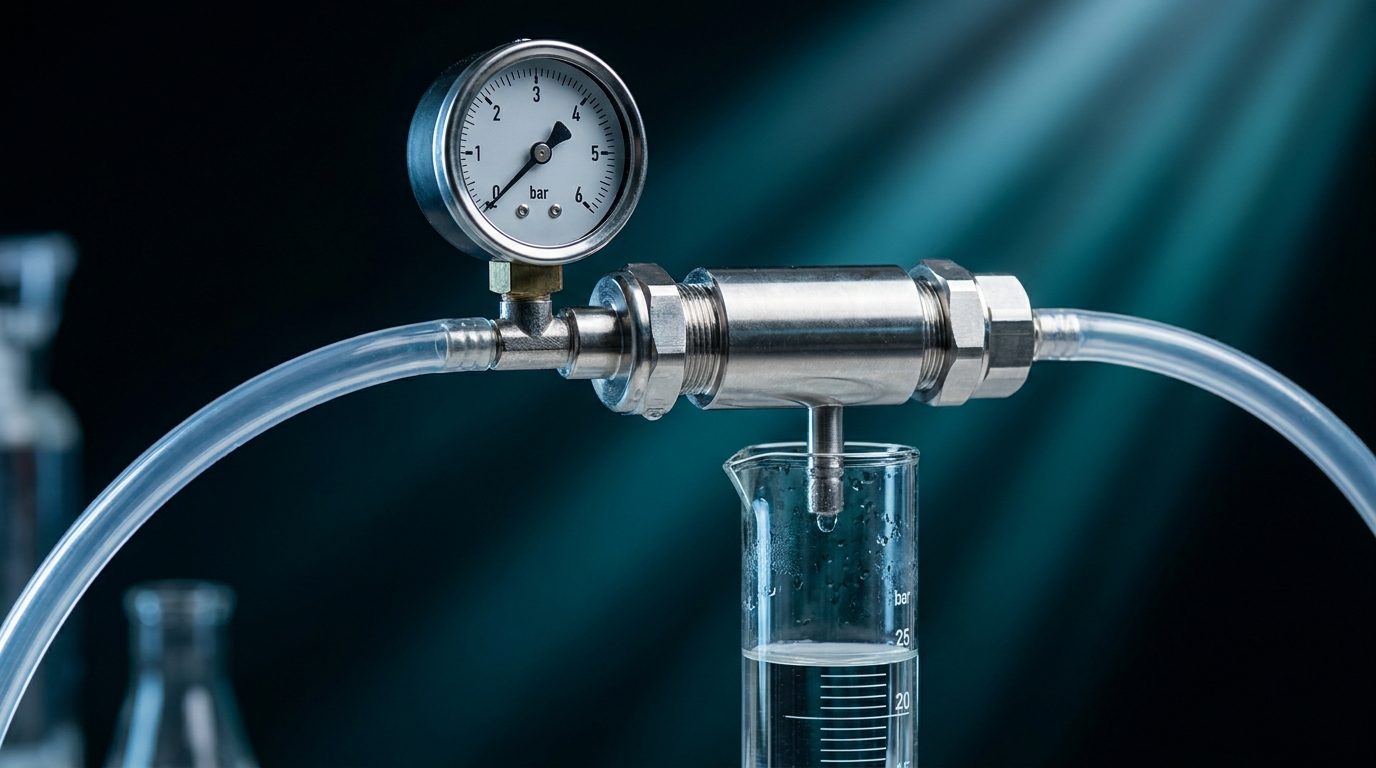
A plant's new brackish system had barely started up when the first-stage pressure drop began climbing. Feed turbidity was under 0.5 NTU the whole time, which is why nobody thought pretreatment was the problem. When they finally ran a silt density index on the RO feed, it came back at 6.2. The multimedia filter had channeled, fine colloidal iron was slipping through, and the lead elements were already carrying a load you could feel as a differential pressure creep. Turbidity said the water was clean. The membranes disagreed.
That gap is the whole reason silt density index exists. Turbidity tells you how much light a sample scatters. SDI tells you how fast that water plugs a membrane. Those are not the same measurement, and on RO feed the second one is the one that predicts your element life.
Every major membrane maker, DuPont FilmTec, Hydranautics, Toray, NanoH2O (formerly LG Chem / LG NanoH2O), writes an SDI limit into its design guidelines. Cross it and you are running outside the envelope the warranty assumes. So the test is worth understanding properly, because it is easy to run wrong and easy to trust past the point where it earns your trust.
What the number actually measures
SDI is a plugging test, not a concentration. You push the water through a 0.45-micron membrane filter (a 47 mm white hydrophilic disc under ASTM D4189) at a constant 30 psi, and you time how long it takes to collect a fixed 500 mL sample at the start and again after the filter has been fouling for a set interval. The standard reporting interval is 15 minutes, which is why you see it written as SDI15.
The formula is straightforward. SDI equals (1 − Ti/Tf) × 100, divided by the total elapsed minutes. Ti is the seconds it takes to collect your first 500 mL through a clean filter. Tf is the seconds for the same 500 mL after 15 minutes of the filter loading up. So an SDI15 of 5 means the filter plugged 75% over that window: the final sample takes four times as long to collect as the first. An SDI15 of 3 is 45% plugging, where the last sample takes about 1.8 times as long. The bigger the number, the faster the water fouls a surface, and an RO membrane is a surface.
One consequence of the math trips people up: because you divide by 15, the maximum SDI15 you can even record is a hair under 6.67. If a filter plugs completely before 15 minutes, you cannot run the full test: you drop to a 10- or 5-minute interval and note it, because SDI10 and SDI15 are not interchangeable numbers.
The limit every membrane maker writes down
The design guideline is consistent across brands: keep RO feedwater below SDI15 of 5. DuPont's FilmTec technical manual pairs that with a feed turbidity under 1.0 NTU and free chlorine under 0.1 ppm as the standard operating envelope. Hydranautics, Toray, and NanoH2O land on the same SDI15 < 5 ceiling in their pretreatment recommendations.
Five is the ceiling, not the target. FilmTec's own literature notes the correlation between SDI and fouling material tightens as you go lower, and most people who run these systems for a living design pretreatment to hold SDI15 under 3, with under 1 being what you want on a system feeding thin-film composite membranes at high flux. The reason is that fouling concentrates at the membrane surface as flux and recovery climb, so the same feed SDI does more damage on a system pushed hard than on one loafing. A borderline SDI of 4.5 on a conservatively designed system might run fine for years. The same water on a system designed for aggressive recovery will hand you a cleaning schedule.
The number is also a warranty-relevant fact, not just a design nicety. When an element fails early and the manufacturer asks for feedwater records, an SDI log that sat above 5 is the first thing they point to. No log at all is nearly as bad.
How to run it without fooling yourself
The test is simple enough that people get careless. A few things quietly wreck the result. Air in the filter holder is the big one: a bubble under the disc changes the effective area and gives you a low first reading, which inflates the apparent plugging rate later. Bleed it fully before you start the clock. Pressure has to hold at 30 psi the entire run; if your regulator sags as flow drops, your Tf is measuring the regulator, not the water.
Temperature matters more than people expect because water viscosity changes with it, and SDI has no temperature correction built in. Run the initial and final samples more than a degree apart and you are partly measuring the thermometer. Sample the actual RO feed, downstream of cartridge filters and any chemical dosing, not the raw source: the whole point is the water the membranes see. And handle the discs like they matter: a fingerprint or a reused filter gives you a number you will misread as a process change.
If you are logging SDI as a trend rather than a one-time acceptance test, run it the same way every time: same tap, same operator habits, same time relative to backwash on your media filters. A media filter reads clean right after backwash and dirtier just before the next one, so an SDI taken at a random point in that cycle tells you less than one taken at a fixed point.
When the test passes and the membranes foul anyway
This is the part that costs people money, because they trust a passing SDI and stop looking. SDI captures particulate and colloidal plugging on a 0.45-micron filter over fifteen minutes. It will pick up biological solids that happen to be suspended in the sample, but it does not measure biofouling potential (the tendency of dissolved nutrients and bacteria to grow a biofilm over time) and it does not see everything that fouls a membrane over months.
Biofouling is the classic blind spot. A feed can post a clean SDI15 of 2 and still be loaded with nutrients and bacteria that colonize the lead elements and build biofilm over weeks, a timescale the 15-minute test cannot reach. If your differential pressure climbs but your cleanings recover with a high-pH biocide wash rather than an acid wash, you were fighting biology the SDI never flagged. Organic and colloidal fouling that develops slowly can behave the same way: modest SDI, real fouling, because the mechanism is longer than the test window.
The inverse also happens. A briefly spiking SDI right after a filter upset can read alarmingly high without meaning your membranes are in trouble, if the upset was transient and the load never actually reached the elements. SDI is a snapshot of one tap at one moment. It is a genuinely useful snapshot. But it is a screening index, and treating it as a complete fouling forecast is how the plant in the opening paragraph got surprised in the other direction. If you need a more physically rigorous particulate measure, the modified fouling index (MFI) is derived from cake-filtration theory and tracks particulate load more linearly, which is why it shows up in engineering studies even though SDI remains the field-standard acceptance test.
What to do when SDI comes back high
A high number is a pretreatment problem, not a membrane problem, and you fix it upstream. If suspended solids are driving it, multimedia filtration knocks it down, and a well-run media filter with the right bed can take a raw SDI well above 5 down under 3. Add a coagulant ahead of the filter when the load is fine colloids the media alone will not catch: colloidal iron, silica, and clay are the usual suspects, and they are exactly what turbidity underreports. A 5-micron cartridge on the RO feed is a polish and a safety net, not a primary SDI reducer; if your cartridges are the thing dropping your SDI, they are also loading up fast and telling you the real pretreatment is undersized.
When conventional filtration cannot hold SDI reliably (surface water, variable feed, heavy organic or colloidal load), ultrafiltration is the honest answer. UF membranes put a hard barrier ahead of the RO and routinely deliver feed at SDI15 under 2, and they do it consistently instead of drifting with the media bed's condition. It costs more up front. It costs a lot less than replacing a first stage of fouled 8-inch elements twice a year.
Practical Bottom Line
Run SDI15 on the actual RO feed, log it, and design pretreatment to hold it under 3 rather than merely under the 5 ceiling: the margin is what protects you when your media filter has a bad week. Trust the number as a particulate screen and distrust it as a complete fouling forecast, because it cannot see biofouling and cannot reach the timescales that actually kill elements. Fix a high SDI upstream with the right filtration, not by hoping the membranes tolerate it. And once your feedwater is genuinely in spec, compare membranes on their published data sheets: the NanoH2O BW 400 R G2 shows higher rejection than the FilmTec BW30 PRO-400 at the same test pressure (99.8% against 99.6% stabilized). Clean feedwater earns you that margin.
Enviro Membranes stocks genuine NanoH2O (formerly LG) RO elements, ready to ship from McAllen stock. See current models and prices at enviromembranes.com/shop. Once your feed is in spec, send us your water analysis at enviromembranes.com and we'll tell you which membrane fits.
Sources
- FilmTec Reverse Osmosis Membranes Technical Manual (SDI, turbidity, and chlorine feedwater limits), DuPont
- Colloidal and Particulate Fouling Prevention (Tech Manual Excerpt), DuPont
- TSB113: Procedure for Measuring Silt Density Index (SDI), Hydranautics/Nitto
- ASTM D4189 Standard Test Method for Silt Density Index (SDI) of Water, ASTM International
- Silt Density Index: The RO Gatekeeper, Sterlitech
- SDI: Silt Density Index (test method and calculation), Lenntech
- FilmTec BW30 PRO-400 Element Product Data Sheet, DuPont Water Solutions
- LG BW 400 R G2 Brackish Water RO Membrane Data Sheet (99.8% rejection, low-dP 34-mil spacer), NanoH2O (formerly LG Chem)
- How to Clean a Commercial RO Membrane (So the Cleaning Actually Holds), Enviro Membranes
- Brackish Water Reverse Osmosis: Why Feed Chemistry Sets Your Recovery Limit, Enviro Membranes